
Does Your Indicator Actually Work? How to Backtest It with Claude AI
From Indicator to Strategy in six steps.


This is Part 2 of our series. In Part 1, we built a working indicator using Claude and the skill file going from a plain English idea to a live chart in under 30 minutes. This post picks up exactly where that one ended.
Haven’t read Part 1 yet? Start there first. This won’t make as much sense without it.

You’ve got an indicator on your chart and it looks good!
But here’s the question nobody asks until, “they’ve lost money” — does it actually work? That’s what a backtest answers.
Quick Recap: Indicator vs. Strategy
Before we start, one distinction worth nailing.
An indicator is observational. It doesn’t trade anything.
A strategy is the same logic, wrapped in a framework that TradingView can actually test. It has entry rules, exit rules, position sizing and a performance report you can read.
The indicator you built in Part 1 is already 80% of the way there. We’re just adding the other 20%.
Step 1: Open Claude and Load the Skill File
We’ll be using the exact same setup as Part 1. You can find the link to download the skill file below.
Important: Don’t forget to upload the entire .zip folder! The skill isn’t just a single file, and Claude needs the complete folder to understand the full context.
Download the skill File
Open a new Claude conversation, upload the Pine Script skill file (the full .zip), and wait for it to load. If you still have your Part 1 conversation open, you can continue there, but a fresh session with the skill file reloaded tends to give cleaner output.
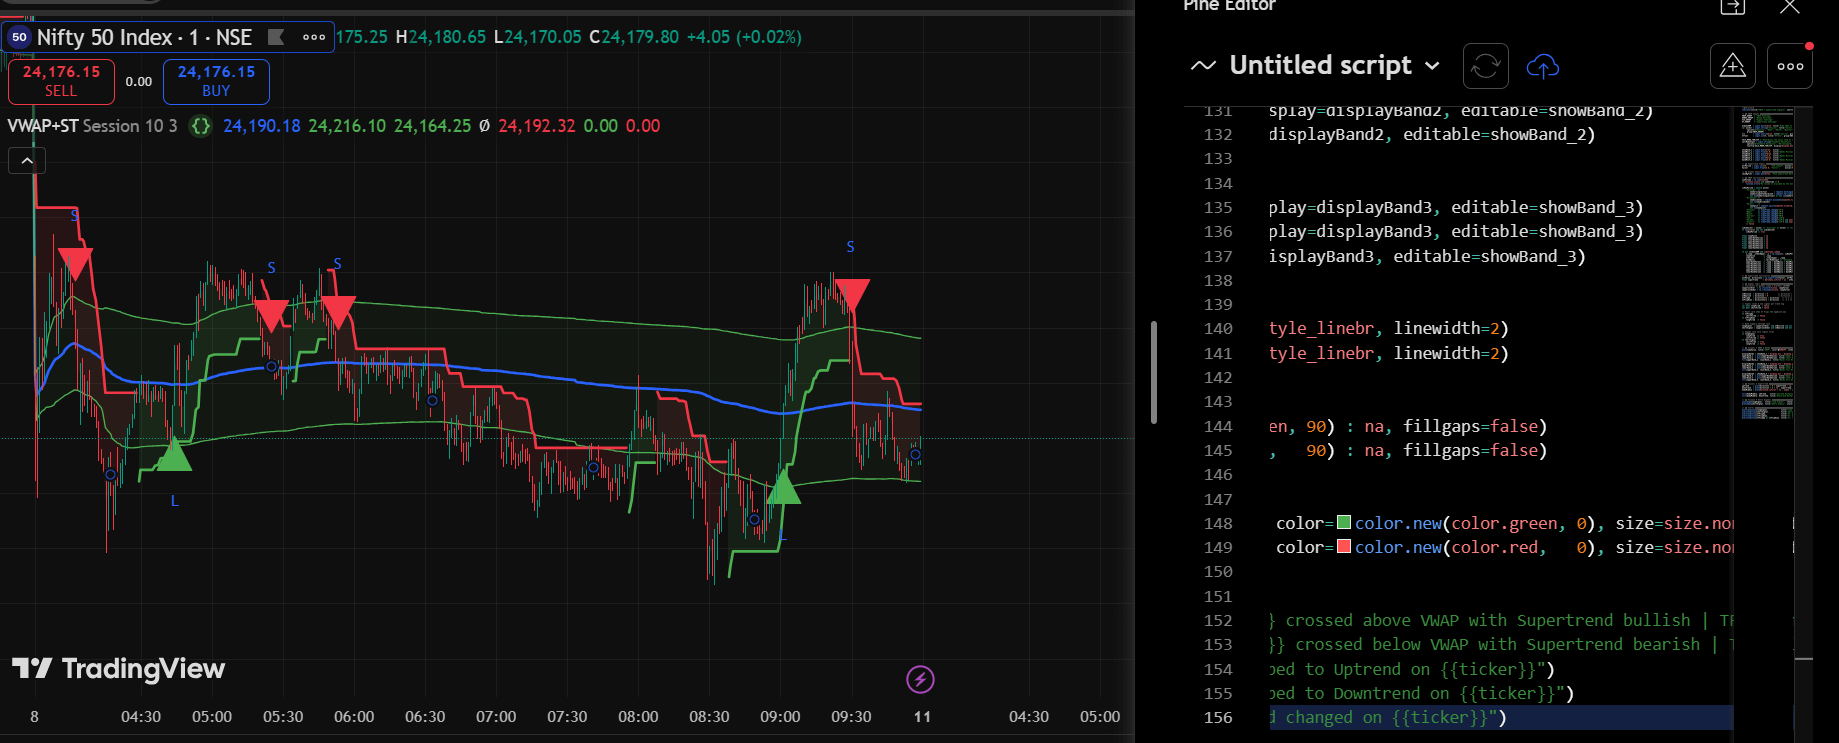
In this session, we built a custom indicator inspired by our recent post on VWAP lines and the Supertrend! You can find the link to the original post below, along with a Google Drive link to download the indicator.
Download the indicator
“Here is a Pine Script indicator I built. I want to convert it into a strategy so I can backtest it in TradingView’s Strategy Tester. Use /pinescript to help me plan it.”
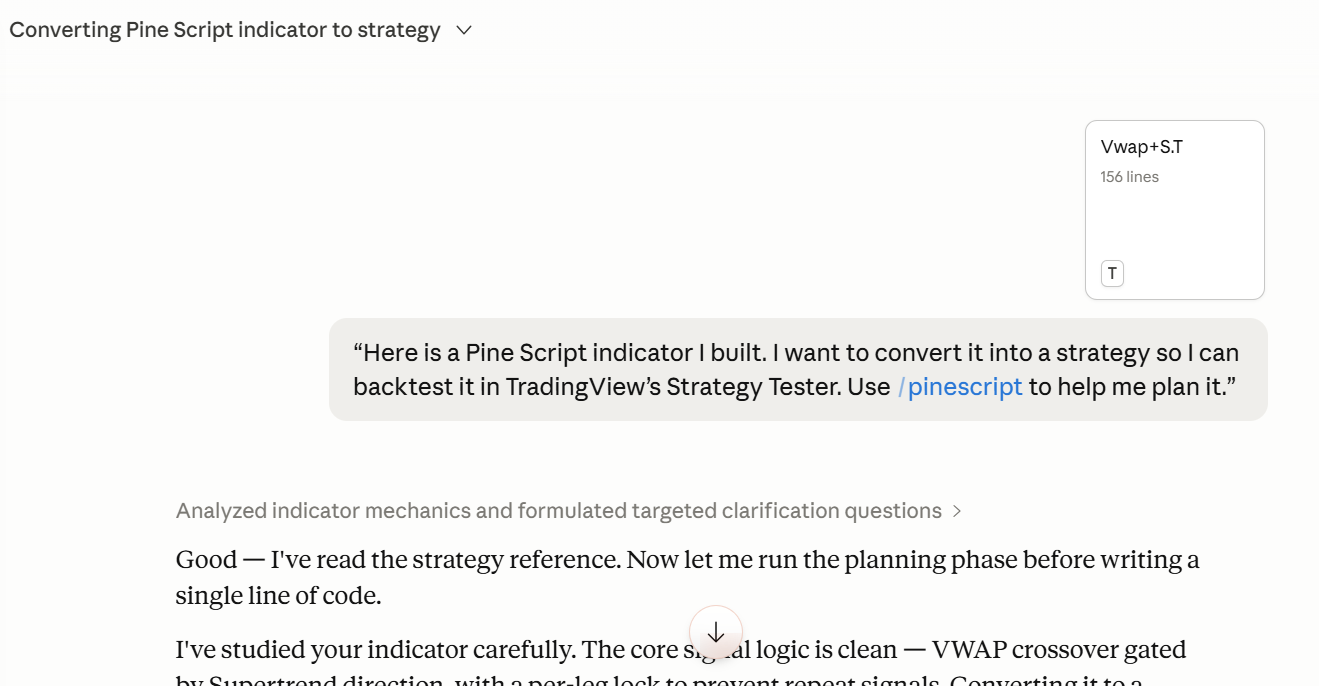
That’s the whole prompt. Claude takes it from there.
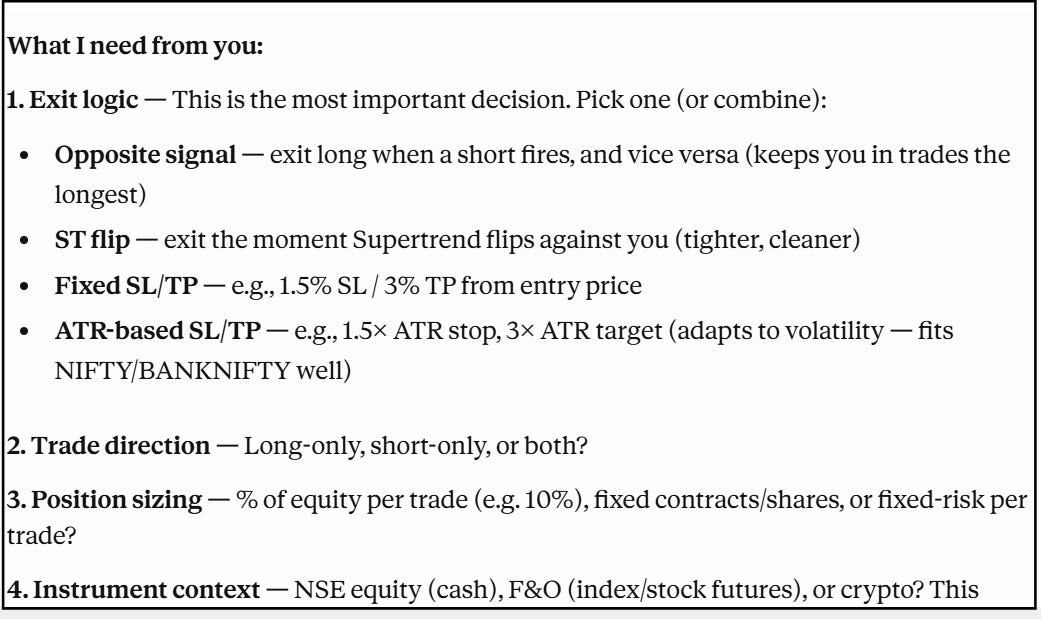
Step 2: Claude Asks Its Questions
In the previous post, we defined our entry conditions based on our indicators. In this one, we need to define our exit conditions so our strategy works well in the real market.
Also, Claude won't touch the code until it knows exactly what to build. This time, the questions are about how the strategy should behave, not just what it should show.
Step 3: Review the Strategy Spec
Before any code is written, Claude sends back a Strategy Spec a plain English summary of exactly what it’s about to build.
S .crossover(close, vwap) + direction < 0. Short: ta.crossunder(close, vwap) + direction > 0. Both gated by per-leg lock vars.
Exits: Opposite signal only. strategy.entry("Short", strategy.short) auto-reverses the open long (and vice versa) — no separate strategy.exit() needed since pyramiding = 0.
Filters: None by default. Optional NSE session filter input (9:15–15:30 IST) — off by default, user can enable.
Notes: process_orders_on_close=false (default) — entries fire at next bar's open, which is realistic for NIFTY futures. lookahead_on from the Earnings/Dividends/Splits anchor branches is stripped — those introduce future bias in backtests. alertcondition() calls removed (not valid in strategy scripts).
Read this carefully. This is your only checkpoint before Claude writes any code.
If everything looks right, reply: Looks good, go ahead.
Step 4: Paste Into TradingView
Once Claude gives you the strategy code:
Open TradingView
Click Pine Editor at the bottom of the screen
Clear the existing code and paste in the strategy code
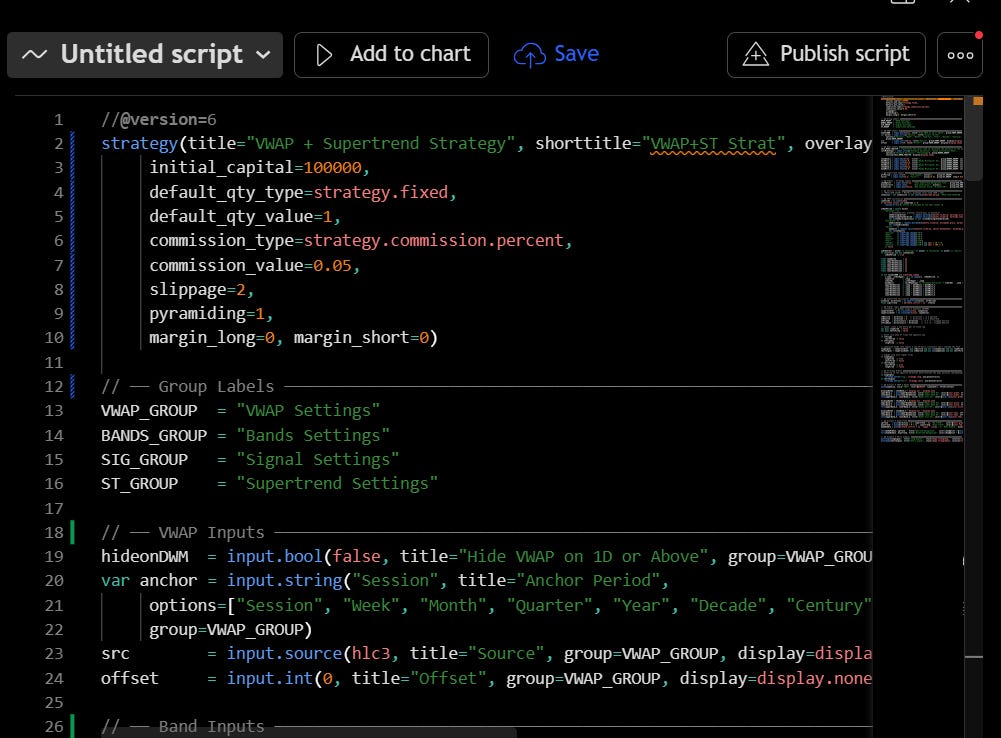
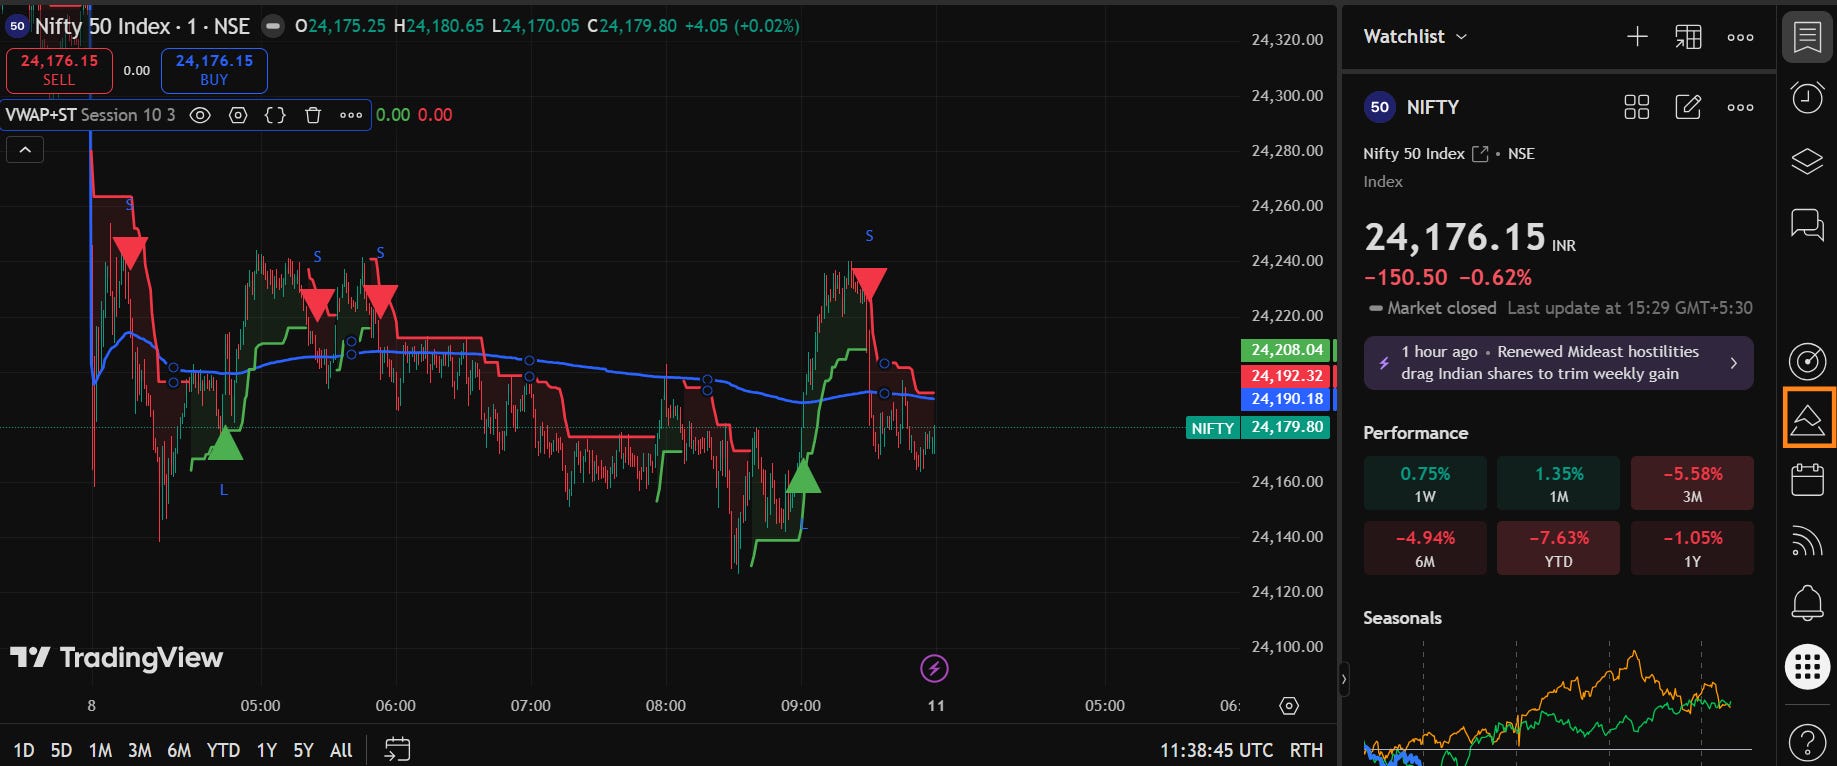
Click Add to Chart
A new panel will appear at the bottom of your screen labelled Strategy Tester.

Step 5: Backtest Setup
Most people open the Strategy Tester and jump straight to net profit. Don’t. The numbers mean nothing until you’ve told TradingView what assumptions to run them on.
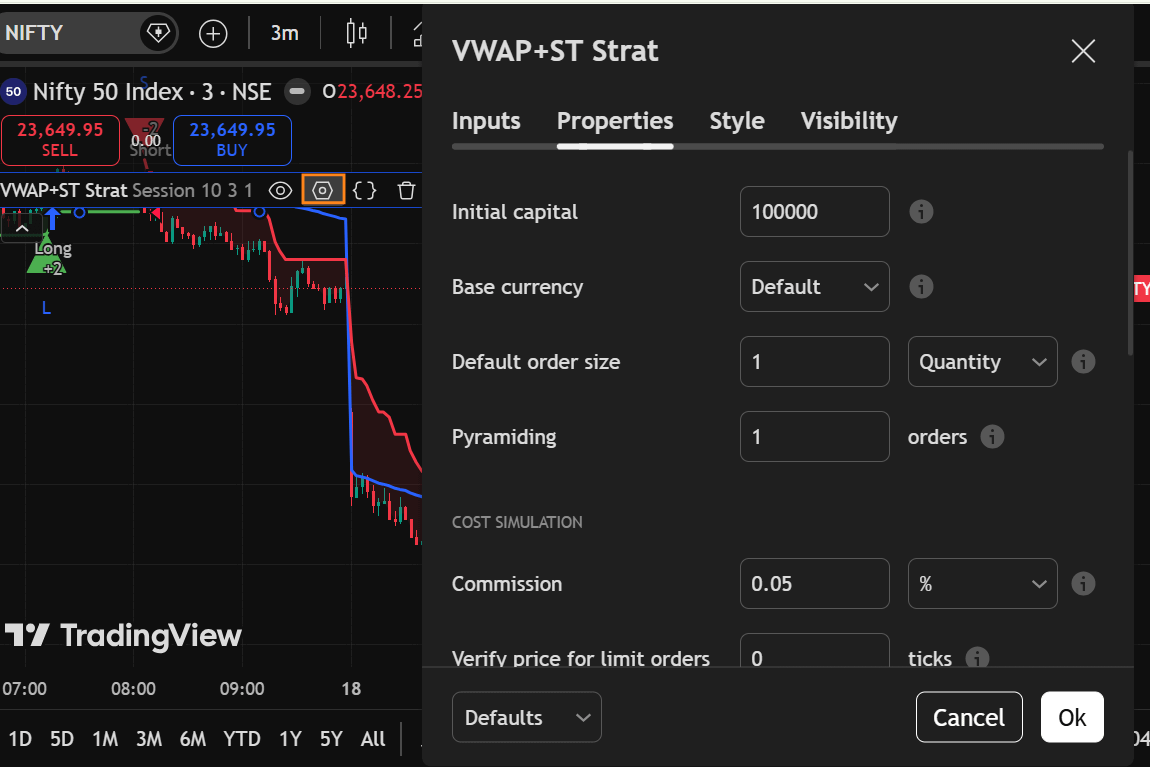
Click the Settings icon on your strategy panel. You’ll see a Properties tab. Three inputs to set before anything else:
Initial Capital: Enter what you’d actually deploy. ₹5L and ₹50L will produce very different profit figures, and neither is wrong. What matters is that the number reflects your real situation, so the results stay meaningful to you.
Commission: For NIFTY futures, 0.03–0.05% per side is a reasonable starting point. Leave this at zero and every strategy looks better than it actually is.
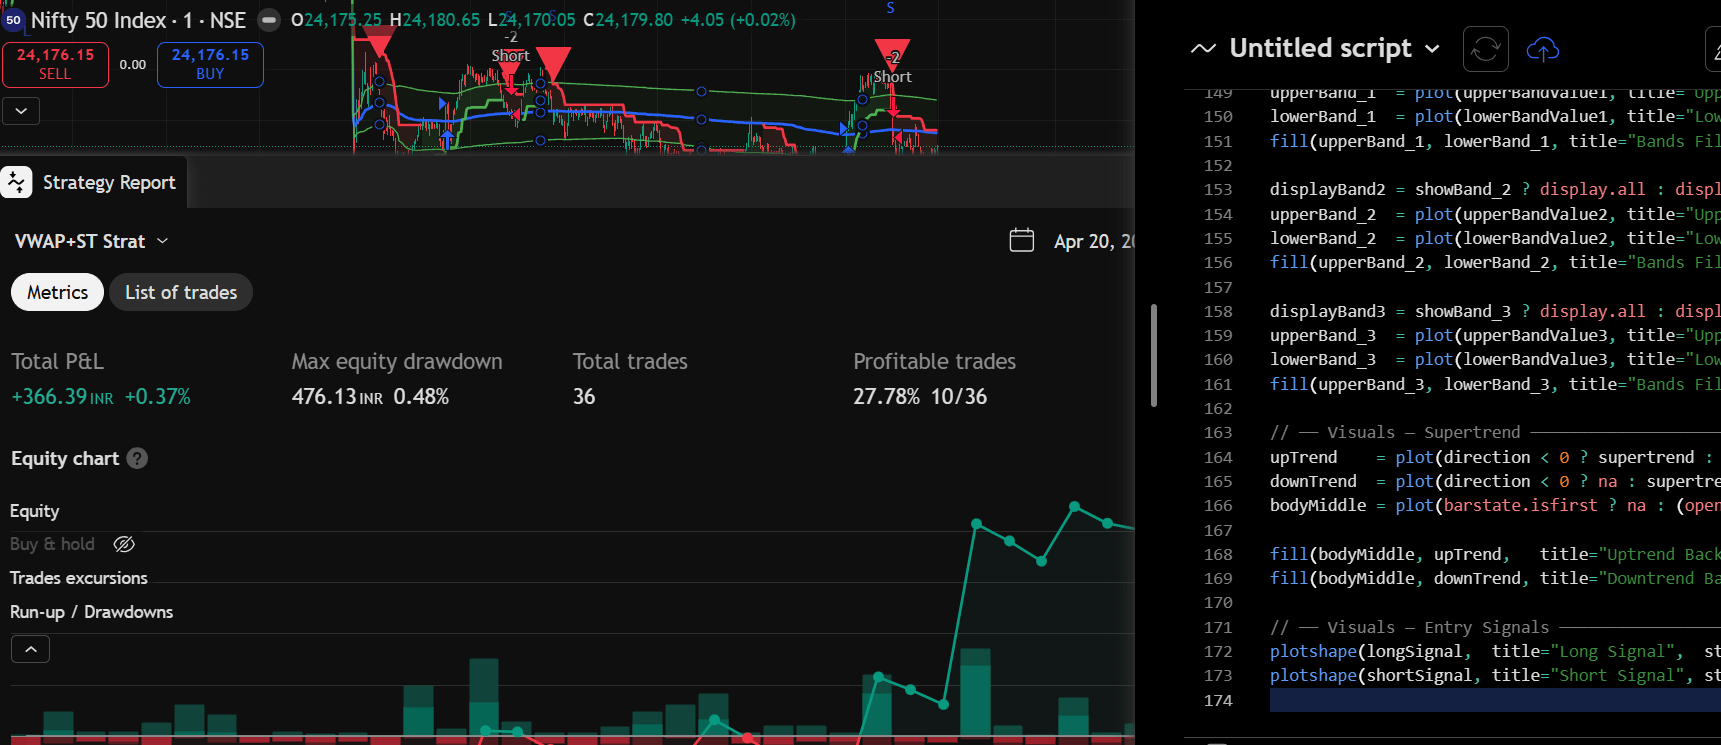
Step 6: Read the Strategy Tester Report
This is the step most people rush through.
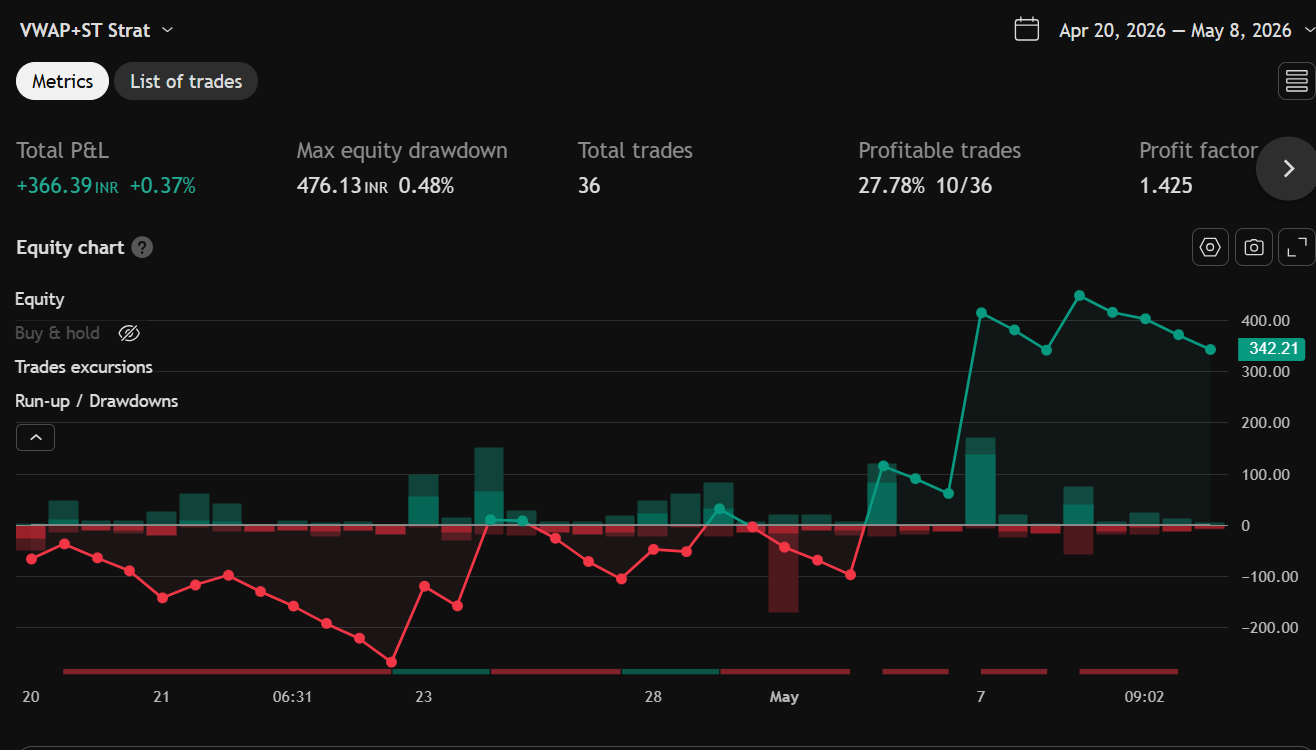
The report has two tabs. Here’s what actually matters in each:
Net Profit: The starting point, not the finish line. A positive number tells you the strategy didn’t lose money historically. That’s it. Check everything else before drawing conclusions.
Win Rate: Easy to misread. A 70% win rate looks strong until the losses are 3x larger than the wins. It only means something when you read it alongside Profit Factor.
Profit Factor: Total profit divided by total loss. Above 1.5 and the strategy is generating more than it’s giving back. Below 1.0, it lost money overall and no further analysis needed.
Max Drawdown: The worst stretch the strategy went through in the entire backtest period. Before you move on, ask yourself: if this was happening to your actual capital in real time, would you have stayed in? If the honest answer is no, the strategy isn’t right for you! regardless of what the net profit looks like.
Number of Trades: Sample size matters. A backtest with 15 trades over two years isn’t a backtest, it’s a handful of data points. You want at least 50–100 trades before the numbers carry any real weight.
List of Trades Tab
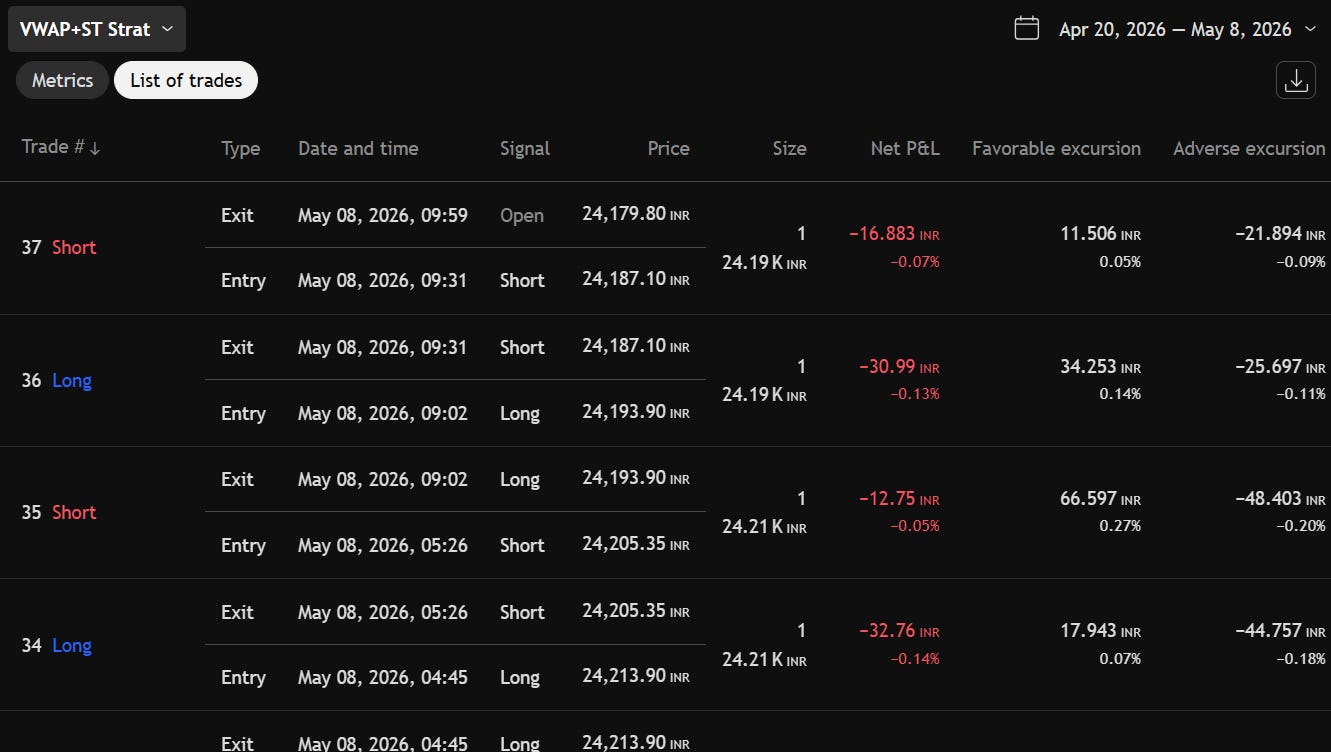
Click individual trades and watch where TradingView marks them on the chart. Ask yourself:
Are entries happening where your logic says they should?
Are exits cutting trades too early, or holding too long into reversals?
Are there obvious bad trades that all cluster around one market condition (e.g., sideways chop)?
This is where you catch logic errors that the numbers alone won’t show you.
What You’ve Built
You took a trading idea. You turned it into a strategy. You checked whether it held up across historical trades.
In Part 3, we go one step further. We will create a telegram bot which messages you everytime your strategy gives a signal!
(Disclaimer: Any video/image/text content is for educational and informational purposes only and does not constitute financial advice. Refer - https://stocko.in/stocko-disclaimer/. Please do your own research or consult a qualified financial advisor before making any investment or trading decisions. Trading in stock markets involves the risk of loss.)